EU-SysFlex blog: First Results from the field test demonstrator in EU-SysFlex
08.04.2020NewsSince the beginning of 2020, a field test demonstrator was set up at MITNETZ STROM. This demonstrator consists of an innovative grid and data integration functionalities which support more planning options and hence more stable grid operation as well as an improved communication between Transmission System Operator (TSO) and Distribution System Operator (DSO).
In Figure 1, a schematic overview of the different functionalities and the architecture of the demonstrator platform are described. The main input data is in the Common Information Model CIM data model and consists of equipment data, topological data and measurements. In addition, forecast information are also imported and used to build future grid states for the forecast horizon.
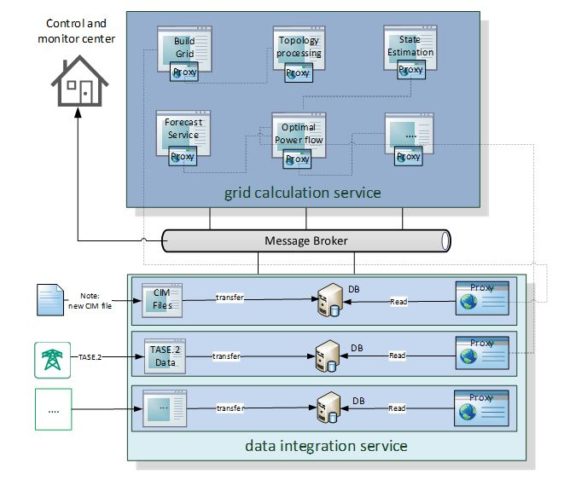
Figure 1:Architecture of the EU-SysFlex field test demonstrator running at MITNETZ STROM.
The system is running in parallel mode at the moment, which means that the functionalities within the demonstrator receive frequently the latest grid and forecast information. Based on this data, active and reactive power flexibility bands are computed via the optimization tool. Since no feedback loop with the grid control center is established by this moment, no optimization results can be applied on the field devices and hence the actual active and reactive power exchange for this network group is not affected.
Since the beginning of 2020, a field test demonstrator was set up at MITNETZ STROM. This demonstrator consists of an innovative grid and data integration functionalities which support more planning options and hence more stable grid operation as well as an improved communication between Transmission System Operator (TSO) and Distribution System Operator (DSO).
In Figure 1, a schematic overview of the different functionalities and the architecture of the demonstrator platform are described. The main input data is in the Common Information Model CIM data model and consists of equipment data, topological data and measurements. In addition, forecast information are also imported and used to build future grid states for the forecast horizon. The system is running in parallel mode at the moment, which means that the functionalities within the demonstrator receive frequently the latest grid and forecast information. Based on this data, active and reactive power flexibility bands are computed via the optimization tool.
Since no feedback loop with the grid control center is established by this moment, no optimization results can be applied on the field devices and hence the actual active and reactive power exchange for this network group is not affected.
Based on this information, the DSO can now estimate flexibility potentials on all of its grid connection points between TSO and DSO, for the current moment and (in a later stage) up to 72 hours in the future. This supports grid operation strategies and decisions as well as the future Redispatch2.0 process. If the DSO chooses to adjust active or reactive power flow between DSO and TSO at a certain grid connection point, the EU-SysFlex demonstrator computes the desired set points to adjust the individual renewable energy sources which participated in the computation of the flexibility bands.
Written by: Dr. Sebastian Wende-von Berg (University of Kassel/Fraunhofer IEE) working on Grid simulation and Grid optimization of the German Demonstrator of flexibility services from resources connected to the distribution network.
For more information about EU-SysFlex, follow us on Twitter, Facebook and LinkedIn.