EU-SysFlex blog: Performance analysis of data exchange and processing in the German Demonstrator
28.10.2020News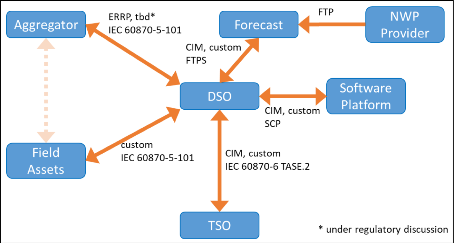
In the German Demonstrator, several different components and platforms have to communicate with each other. In the above figure, a simplified representation of the communication ways is given. From each of these constituents, data is exported or imported and, in most cases, both. These amounts of data have to be processed in order to utilize it for the internal functionalities within the German Demonstrator (State Estimation, OPF, … ). The amount of data and the individual processing times are crucial for the performance of the whole system. In the following, we will focus on the processes within the “Software Platform” in Figure 1 above, which hosts most of the functionalities developed and used within EU-SysFlex.
Analysis:
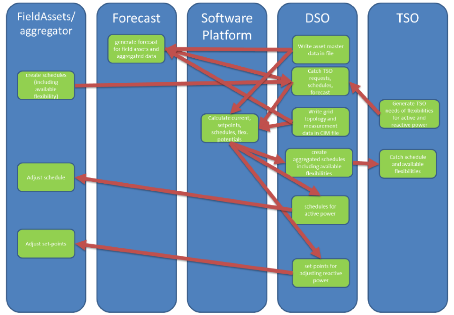
The software platform makes use of two main data streams, namely forecast data and current grid data. The latter consists of grid topology, asset data and up-to-date measurements directly from the grid. Forecast data includes active and reactive power predictions of generators and consumers for 72 hours. In Figure 2 below, one can see data enters and leaves the software platform.
Processing of CIM data: Grid information is updated and exported from DSO regularly every 15 minutes. CIM CGMES data consists of four profiles – Equipment EQ, Topology TP, State Variables SV and Steady State Hypothesis SSH. A characterization of these files is given in Table 1 below.
|
Profile |
Number of Objects | Size of the file |
| EQ | 127000 | 65 MB |
| TP | 12000 | 3 MB |
| SV | 79500 | 12 MB |
| SSH | 59000 |
9 MB |
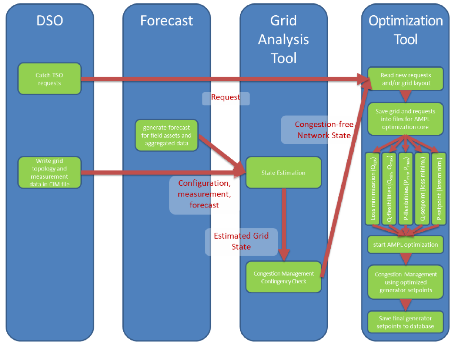
In order to process the CIM data to obtain a grid model for load flow calculations, in a first step, all four profiles are persisted in a dedicated database in parallel. This can take up to 60 seconds to perform this task. In a second step, the CIM data is accessed via a REST service by a routine, which converts the CIM objects into a pandapower grid model. This process and a following topology analysis take 25 and 5 seconds respectively. In Figure 3, the individual steps in data processing and performing the functionalities is shown.
After preparation of the grid data, state estimation and congestion analysis take place. The times needed on average are 5 and 11 seconds respectively. After these processes, congestion free grid models can enter the optimization routines. An optimization consists of five individual optimizations, these are:
- Loss minimization
- Upper active power flexibility
- lower active power flexibility
- Upper reactive power flexibility
- lower reactive power flexibility
In case a specific setpoint is given by the operator, loss minimization is replaced by processing that given setpoint. The whole process of optimization varies strongly in time needed. It ranges between 8 seconds minimum up to about 120 seconds at maximum. The large difference is dependent on the current grid situation, which influences the iterative optimization in order to find a local minimum.
In parallel to the already described processes, the utilization of forecast data is performed. Forecast data is obtained every 15 minutes from a forecast server and its conversion into CIM CGMES objects takes about 40 seconds. This data is then mapped on the related grid assets on the, afore obtained, grid model. Since the forecast spans up to 72 hours and has a 15 minutes resolution, the mapping of forecast data on the grid models can take up to 400 seconds. Eventually 288 forecast grid models are obtained. On each of these models, the described analysis and optimization steps take place. These computations are performed in parallel in order to be available within 15 minutes until new forecast data arrives.
Discussion:
Data exchange and processing is one of the core functionalities within the German Demonstrator. We have to deal with huge amount of data (about some hundred GB each day) which has to be processed in a timely manner. Using standardized data models like CIM CGMES helps by persisting and providing data for the grid functionalities, which are the focus of the project. However, without dedicated data management services and well-defined communication ways between several constituents, innovative functionalities supporting new ways of grid operation, are not possible to use in real time operations. The maximum processing time is given by the process that is designed for efficient coordination with all involved system operators, including needs at local and European level.
Authors: Sebastian Wende-von Berg (IEE, UKS), Benjamin Requardt (IEE), Maik Staudt (MNS)